Facebook is the oldest and most used social networking platform. The platform has the highest number of monthly and daily active users.
The number of users and the influence on social media marketing have made Facebook the first choice of users and marketers.
Due to the high conversion rates, marketers widely use Facebook to run marketing campaigns while receiving the highest ROI.
This article summarizes statistics about Facebook users, usage, and financials.
Facebook User Statistics (Top Picks For 2024)
- There are over 3.06 billion monthly active Facebook users.
- Facebook has over 2.1 billion daily active users.
- India, with 315 million users, has the highest number of Facebook users.
- The United States has over 246 million Facebook users.
- 31% of Facebook users are between 25 and 34 years old.
- Facebook users spend around 30.9 minutes on the platform.
- Facebook has the highest social media marketing ROI of 29%.
How Many Users Does Facebook Have?
More than 3.06 billion people use Facebook every month. Meta currently rules the social media platforms space, with more than half of people using its services.
Facebook is the most successful and most used social media platform, and Meta’s other platforms include Instagram and WhatsApp, which have over 2 billion users.
There Are Over 3.06 Billion Monthly Active Facebook Users
There were around 2.49 billion monthly active users in 2019, and the number of Facebook users has increased steadily in the past few years.
The number of Facebook monthly active users crossed the 3 billion mark in 2023.
The number of monthly active Facebook users experienced a jump of 200 million users between Q4 2019 and Q1 2020.
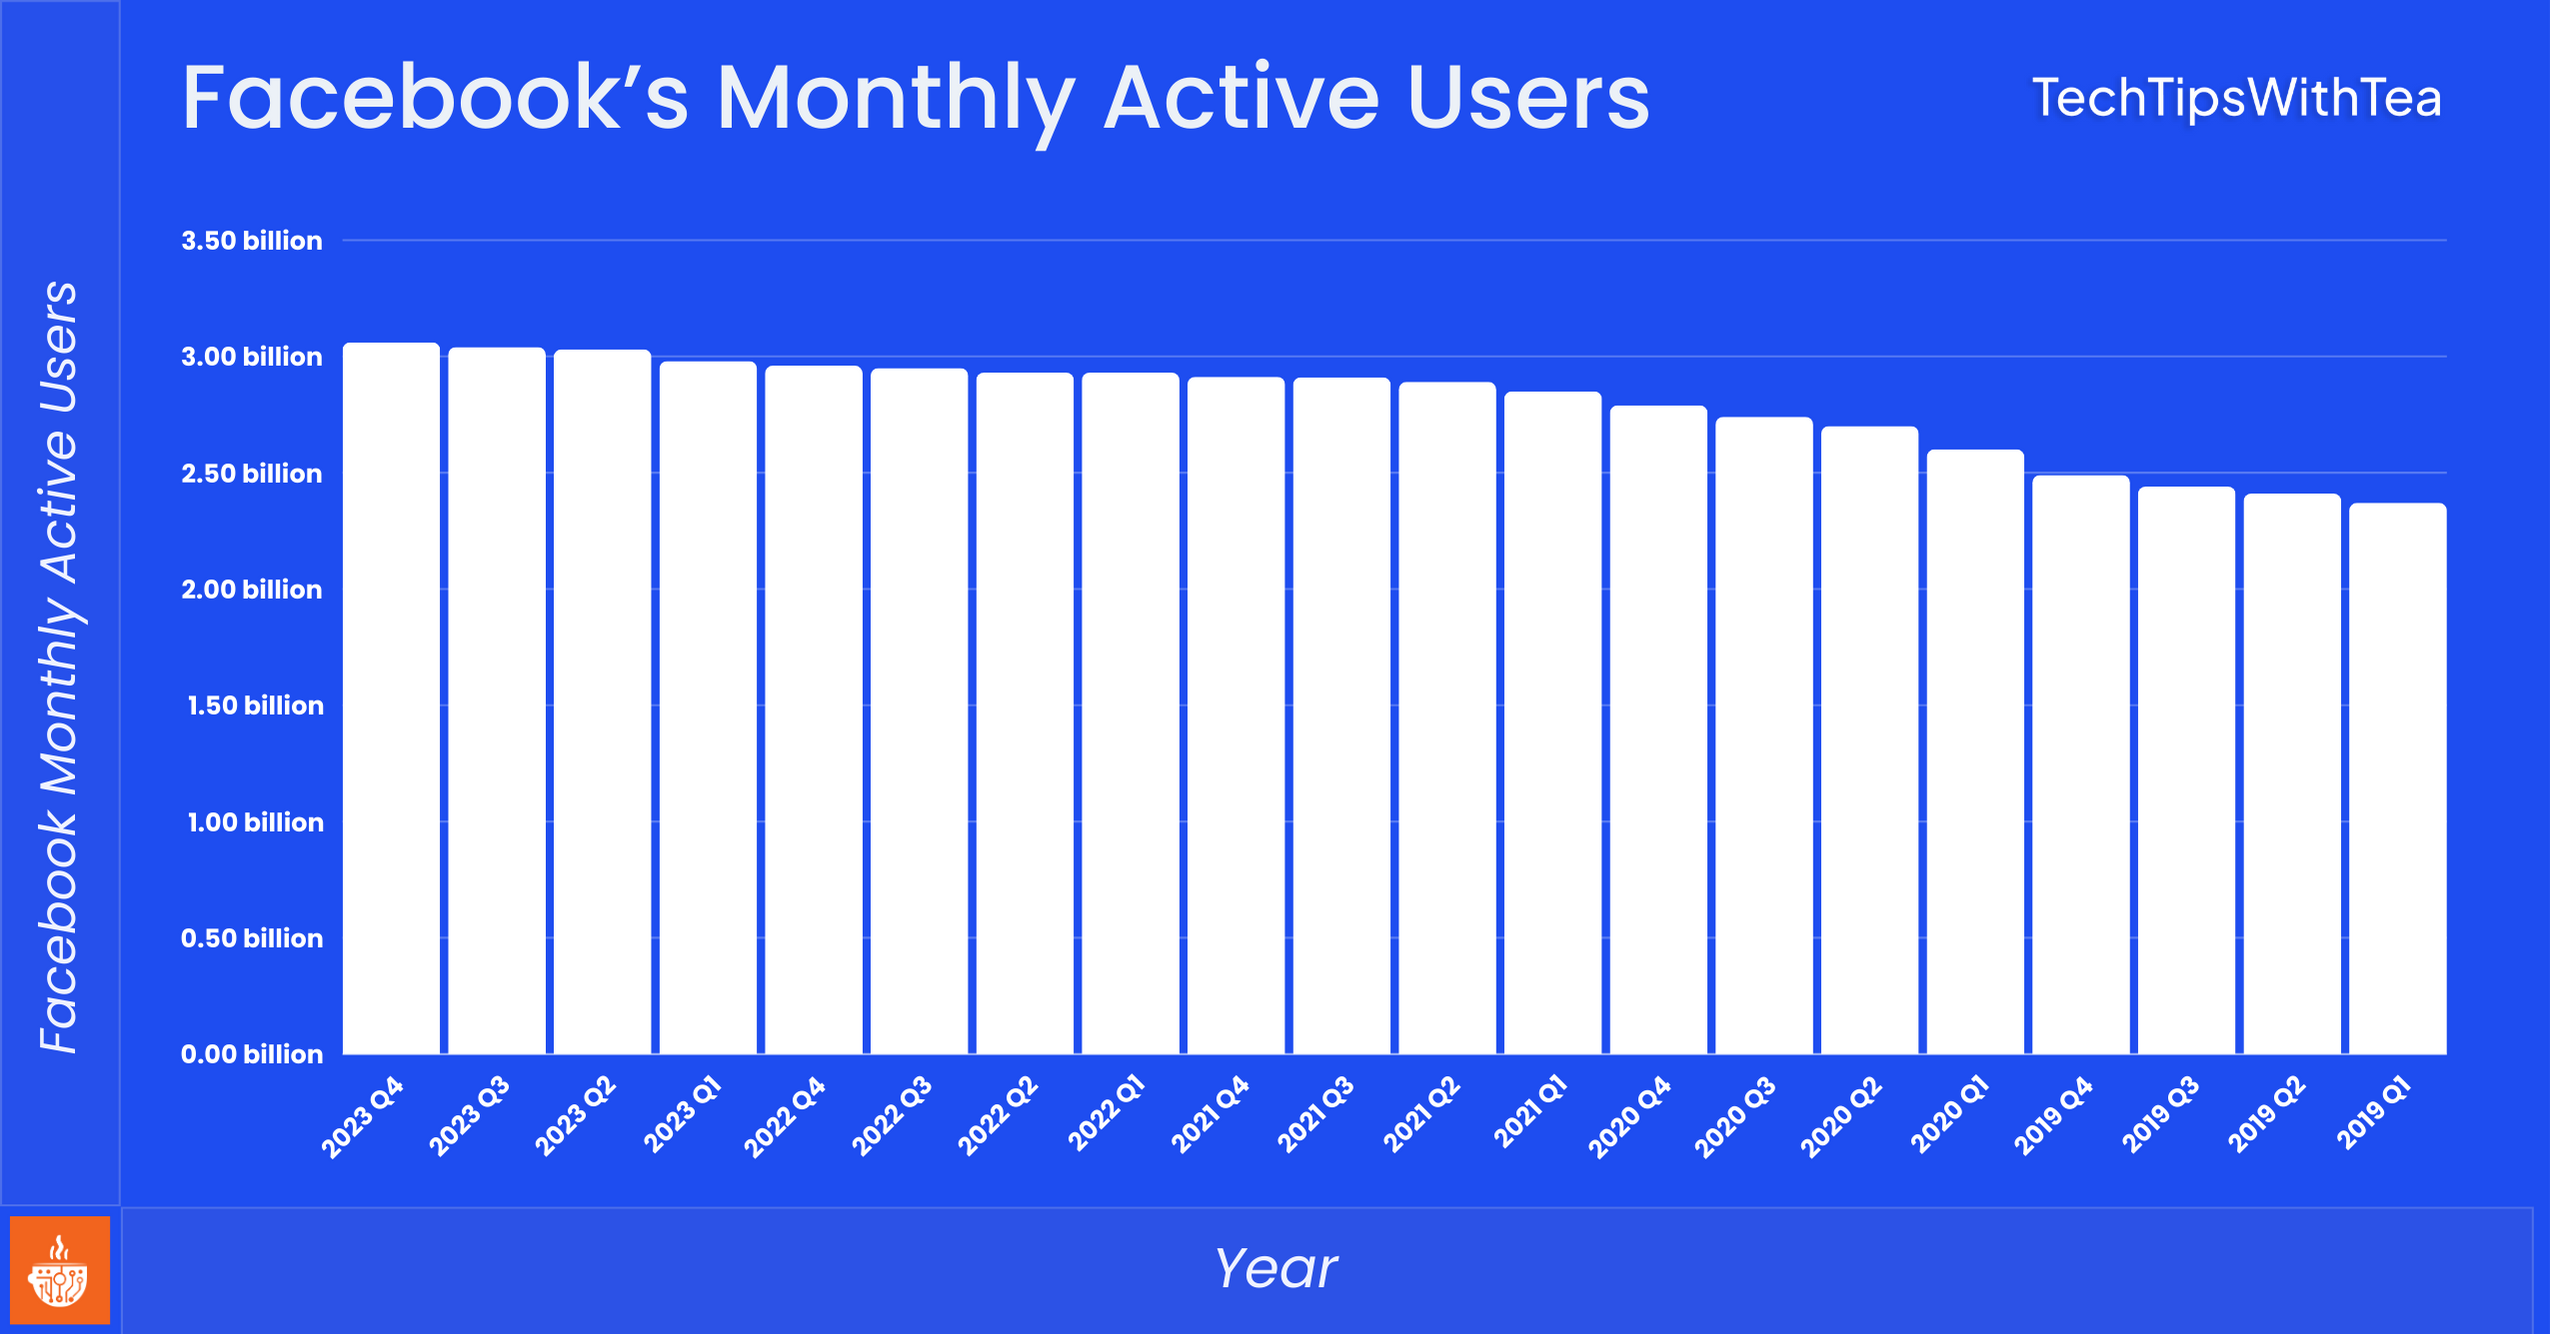
Here is a table with Facebook’s monthly active users over the years by quarter:
| Year | Facebook Monthly Active Users |
|---|---|
| 2023 Q4 | 3.06 billion |
| 2023 Q3 | 3.04 billion |
| 2023 Q2 | 3.03 billion |
| 2023 Q1 | 2.98 billion |
| 2022 Q4 | 2.96 billion |
| 2022 Q3 | 2.95 billion |
| 2022 Q2 | 2.93 billion |
| 2022 Q1 | 2.93 billion |
| 2021 Q4 | 2.912 billion |
| 2021 Q3 | 2.91 billion |
| 2021 Q2 | 2.89 billion |
| 2021 Q1 | 2.85 billion |
| 2020 Q4 | 2.79 billion |
| 2020 Q3 | 2.74 billion |
| 2020 Q2 | 2.70 billion |
| 2020 Q1 | 2.60 billion |
| 2019 Q4 | 2.49 billion |
| 2019 Q3 | 2.44 billion |
| 2019 Q2 | 2.41 billion |
| 2019 Q1 | 2.37 billion |
Source: Statista
Around 2.1 Billion People Use Facebook Daily
Facebook has one of the largest daily active user bases in the world.
There are around 2.1 billion daily active users on the platform in 2023. Facebook’s daily active users have increased drastically during and after the pandemic.
Around 1.6 billion users were recorded in 2019, and this number increased to 2 billion by the end of 2022.
Let us explore the number of Facebook’s daily active users over the years:
| Year | Facebook’s daily active users |
|---|---|
| 2023 Q4 | 2.11 billion |
| 2023 Q3 | 2.08 billion |
| 2023 Q2 | 2.06 billion |
| 2023 Q1 | 2.03 billion |
| 2022 Q4 | 2.0 billion |
| 2022 Q3 | 1.98 billion |
| 2022 Q2 | 1.96 billion |
| 2022 Q1 | 1.96 billion |
| 2021 Q4 | 1.92 billion |
| 2021 Q3 | 1.93 billion |
| 2021 Q2 | 1.90 billion |
| 2021 Q1 | 1.87 billion |
| 2020 Q4 | 1.84 billion |
| 2020 Q3 | 1.82 billion |
| 2020 Q2 | 1.78 billion |
| 2020 Q1 | 1.73 billion |
Source: Statista
With 3 Billion Users, Facebook Is The Most Used Social Media Platform
With over 3 billion monthly users, Facebook is the largest social media platform in 2024.
YouTube is Next to Facebook, which has over 2.4 billion users.
WhatsApp and Instagram have around 2 billion active users and rank third among the most used social media platforms.
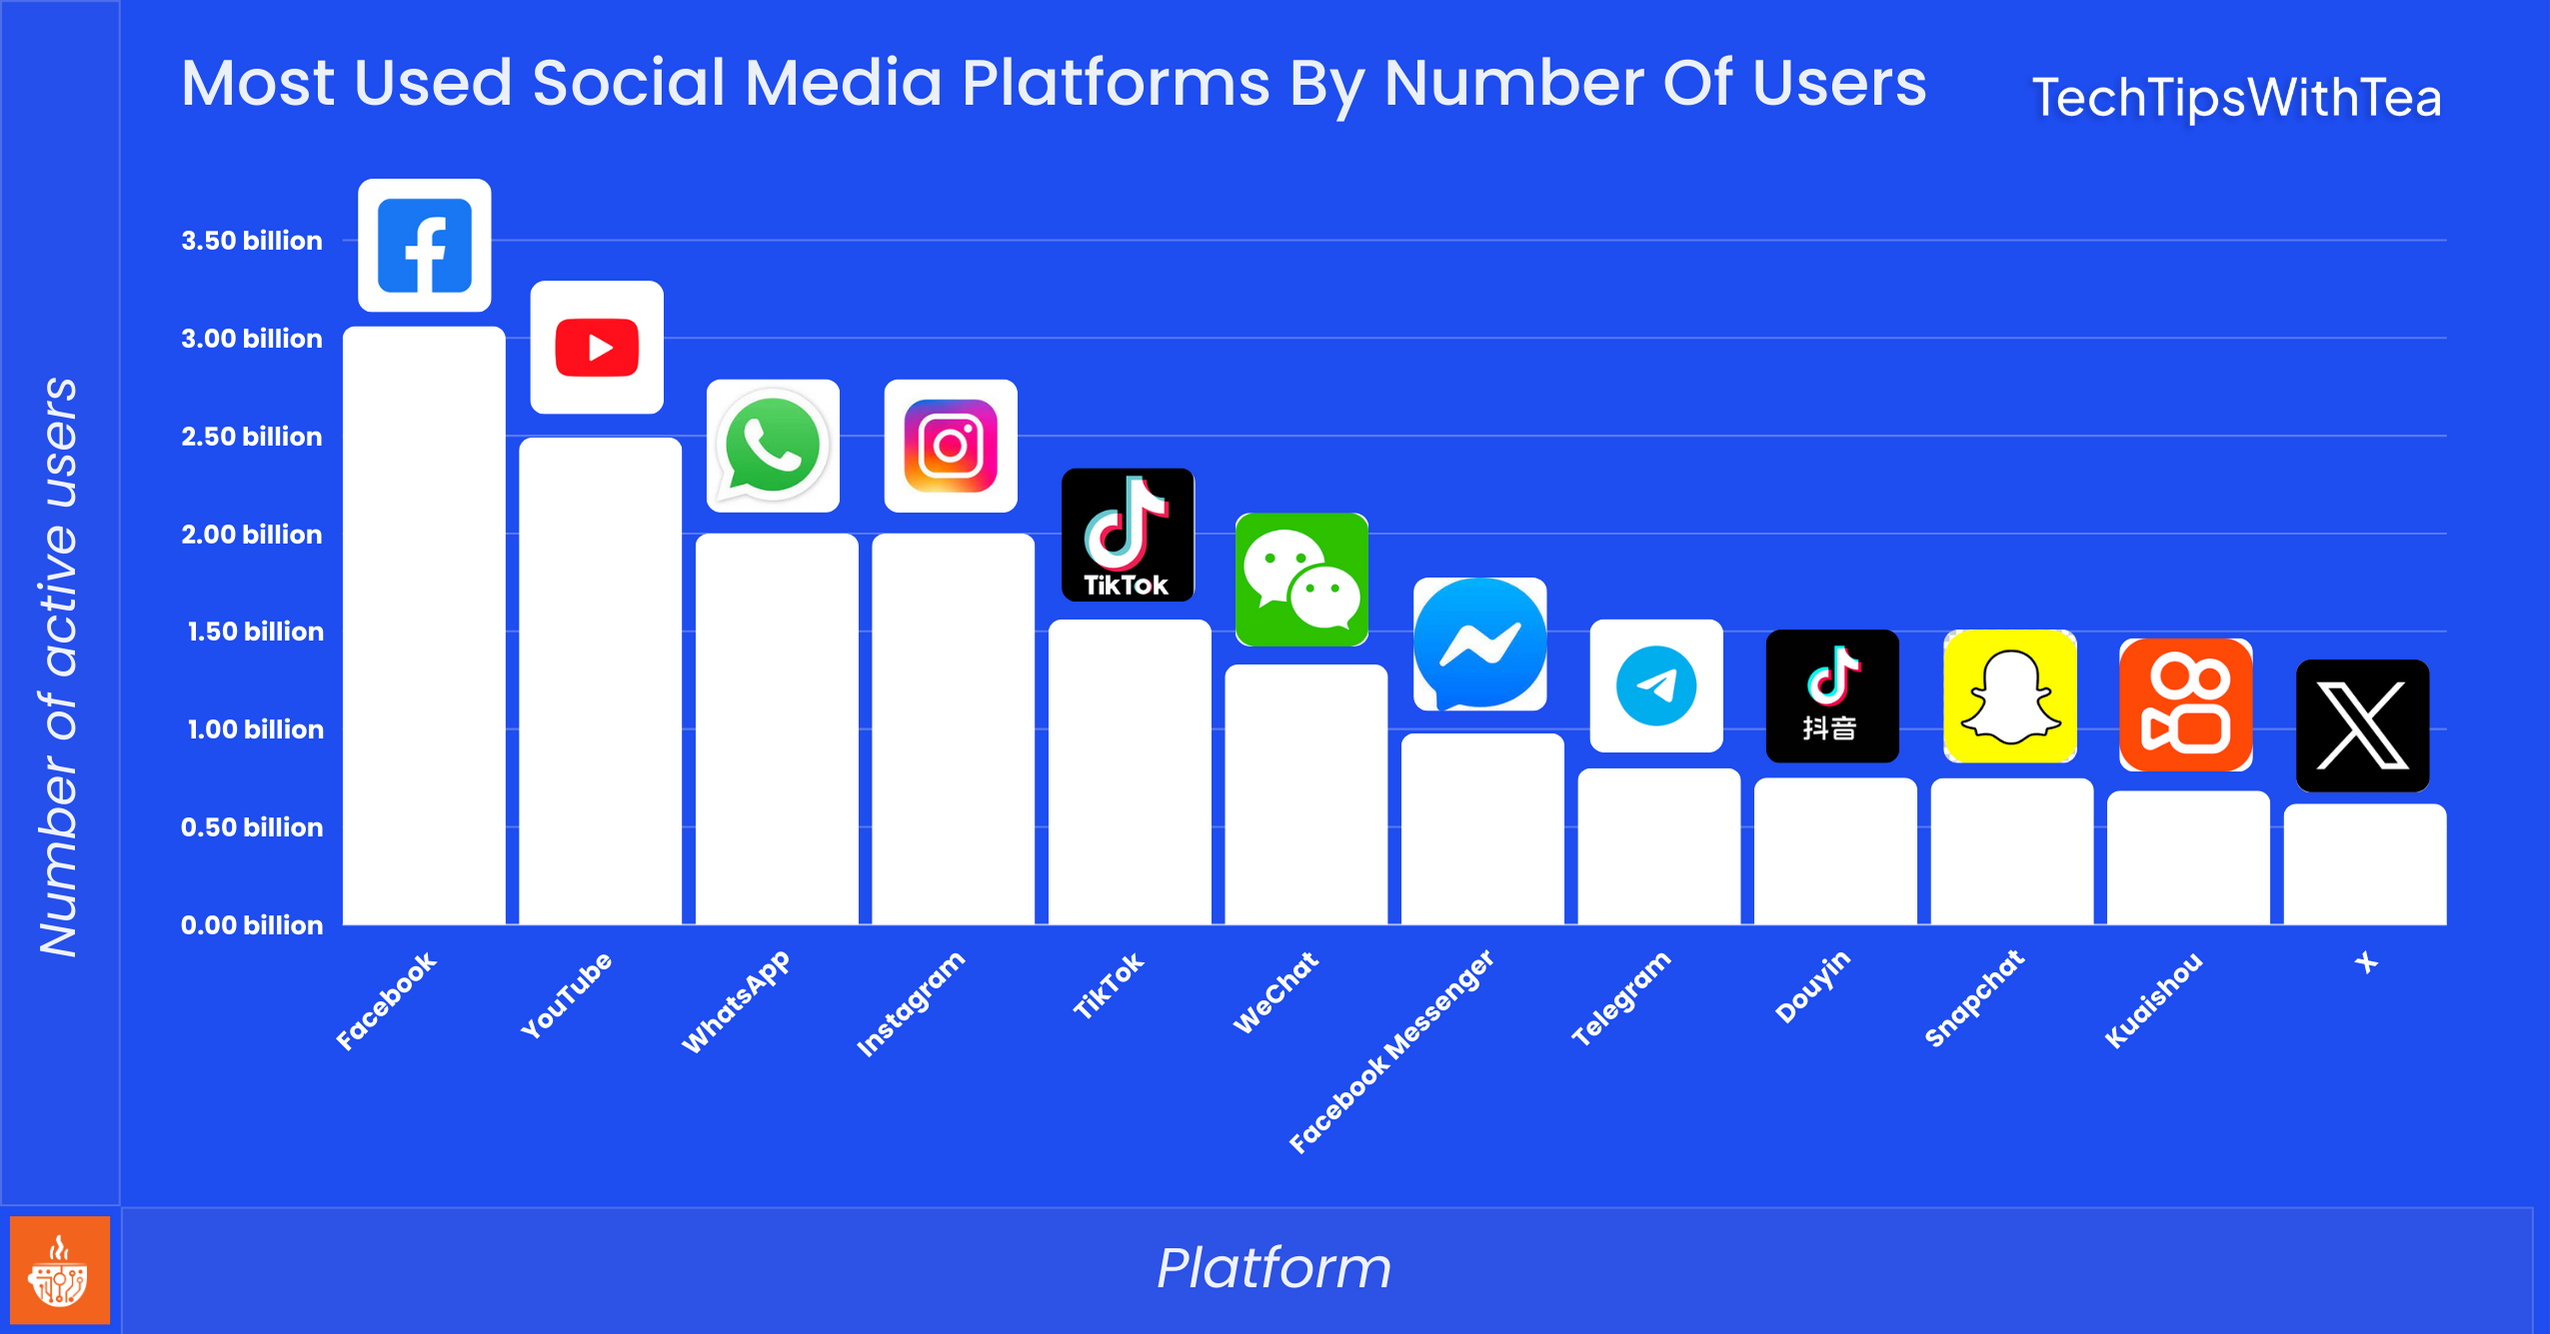
The following table shows the most used social media platforms by number of users:
| Platform | Number of active users |
|---|---|
| 3.06 billion | |
| YouTube | 2.49 billion |
| 2 billion | |
| 2 billion | |
| TikTok | 1.56 billion |
| 1.33 billion | |
| Facebook Messenger | 979 million |
| Telegram | 800 million |
| Douyin | 752 million |
| Snapchat | 750 million |
| Kuaishou | 685 million |
| X | 619 million |
Source: Statista
The United States Has Over 246 Million Facebook Users
Facebook is used by around 246.73 million users in the United States in 2023. The number is further expected to cross 250 million in 2024 and 262.8 million by 2028.
Here is a table with the number of United States Facebook users:
| Year | Number of Facebook users |
|---|---|
| 2019 | 223.42 million |
| 2020 | 235.36 million |
| 2021 | 239.96 million |
| 2022 | 243.24 million |
| 2023 | 246.73 million |
| 2024* | 250.2 million |
| 2025* | 253.56 million |
| 2026* | 256.78 million |
| 2027* | 259.86 million |
| 2028* | 262.8 million |
Source: Statista *Projected numbers
Facebook User Demographics
Facebook’s user base is also diverse; people from every age and gender use the platform in 2024.
In this section, let us explore the user demographic statistics of Facebook users according to country, age, and gender.
Which Country Uses Facebook The Most?
With 315 million active users, India is the leading country with the most Facebook users. The United States is the second country, with 246.73 million Facebook users.
Indonesia has over 119.9 million Facebook users, and Brazil has around 109.5 million users.
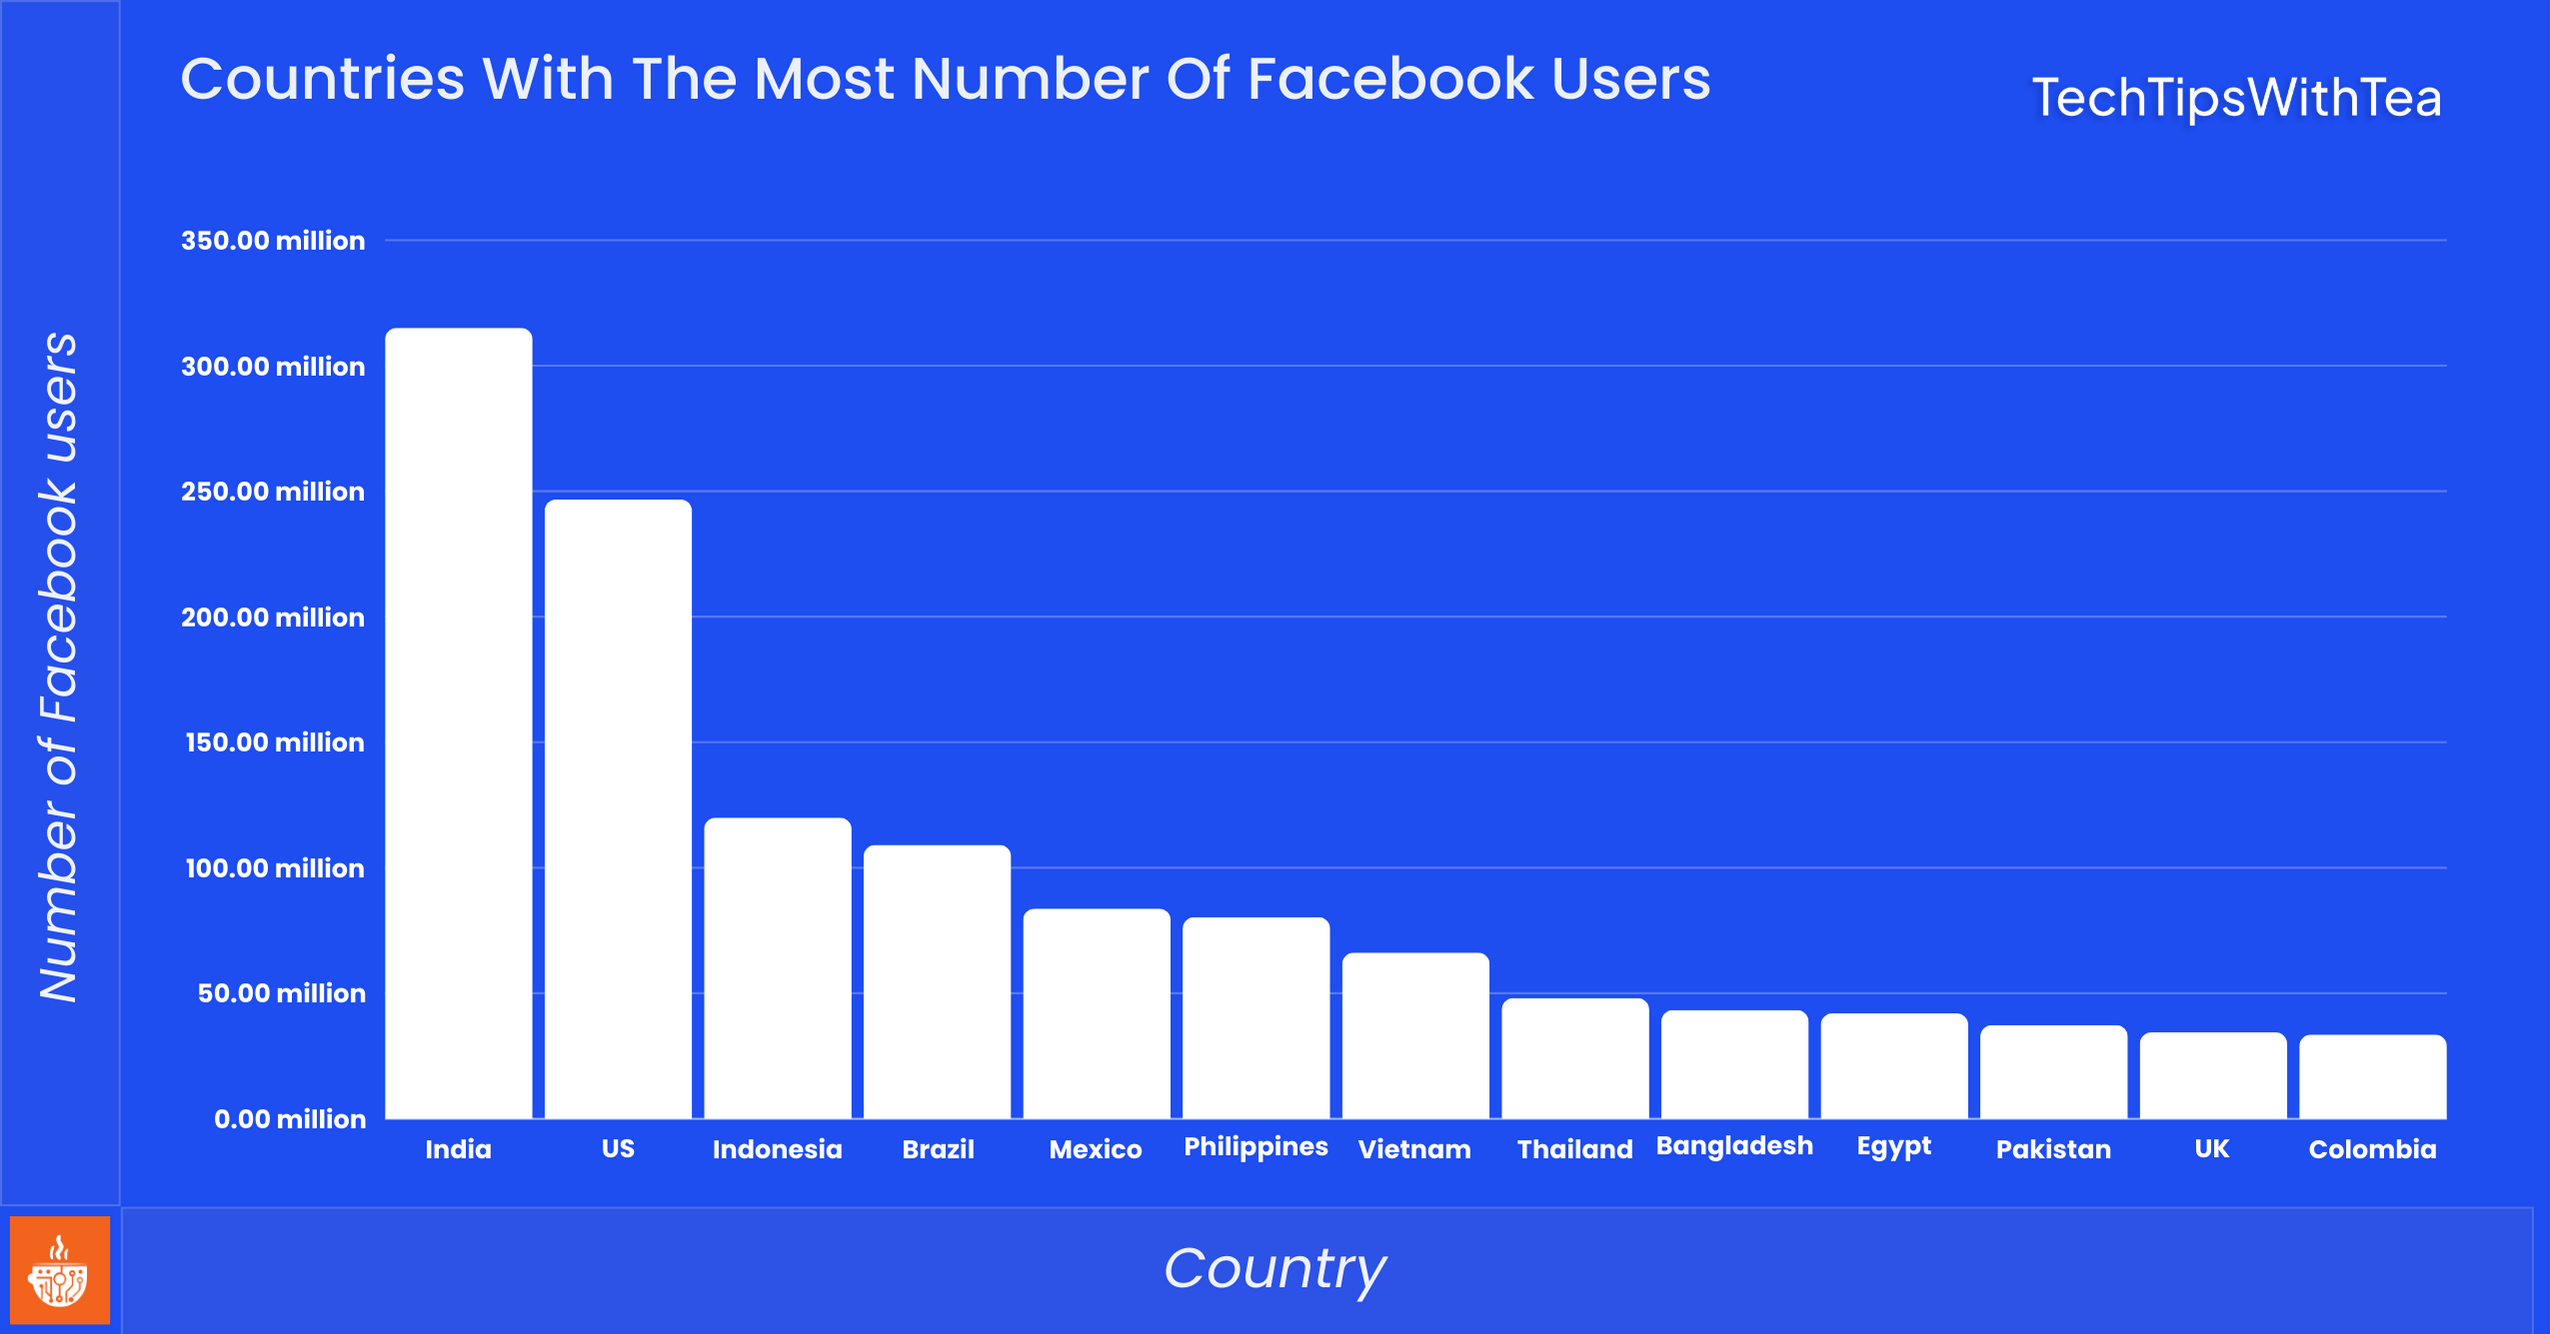
Here is a table of the countries with the most number of Facebook users:
| Country | Number of Facebook users |
|---|---|
| India | 315 million |
| United States | 246.7 million |
| Indonesia | 119.9 million |
| Brazil | 109.05 million |
| Mexico | 83.75 million |
| Philippines | 80.3 million |
| Vietnam | 66.2 million |
| Thailand | 48.1 million |
| Bangladesh | 43.25 million |
| Egypt | 42 million |
| Pakistan | 37.3 million |
| United Kingdom | 34.4 million |
| Colombia | 33.5 million |
Source: Statista
Majority Of Facebook Users Are Aged Between 25 And 34 Years
More than 31% of Facebook users are between 25 and 34 years old. About 23.2% of users are aged between 18 and 24 years.
Due to the increase in content aligning with older users, it is experienced that Millennials are using Facebook more than Gen Z.
The following table shows the distribution of Facebook users by age:
| Age group | Percentage of Facebook users |
|---|---|
| 18 to 24 years | 23.2% |
| 25 to 34 years | 31.0% |
| 35 to 44 years | 20.1% |
| 45 to 54 years | 11.9% |
| 55 to 64 years | 7.6% |
| 65+ | 6.8% |
Source: DataReportal
54.3% Of The United States Facebook Users Are Women, While 45.7% Are Male
Female users in the United States have the biggest share of Facebook users in 2024.
Around 54.3% of Facebook users in the United States are female, and 45.7% of users are male.
On a global scale, 56.8% of Facebook users are male compared to 43.2% of female users.
Source: DataReportal, Statista
Facebook Usage Statistics
Facebook is the most used social media platform of this age. In this section, let us explore the Facebook usage statistics regarding time spent on the platform and the total number of site visits.
Facebook Users Spend Around 30.9 Minutes On The Platform
The average time spent on social media platforms has increased in the last few years. Users in the U.S. spent the most time on TikTok, which was around 53.8 minutes.
On average, Facebook users used Facebook for about 30.9 minutes, and Redditors used Reddit for 24.1 minutes in 2023.
YouTube users spent around 48.7 minutes on the platform, while X users spent 34.1 minutes.
Source: Insider Intelligence
Facebook Was Responsible For About 49.9% Of All Social Media Site Visits In The United States
In comparison, Instagram only made up 15.85% of the total social media site visits in the U.S.
Pinterest and X both have around 14.69% share of social media site visits in the United States.
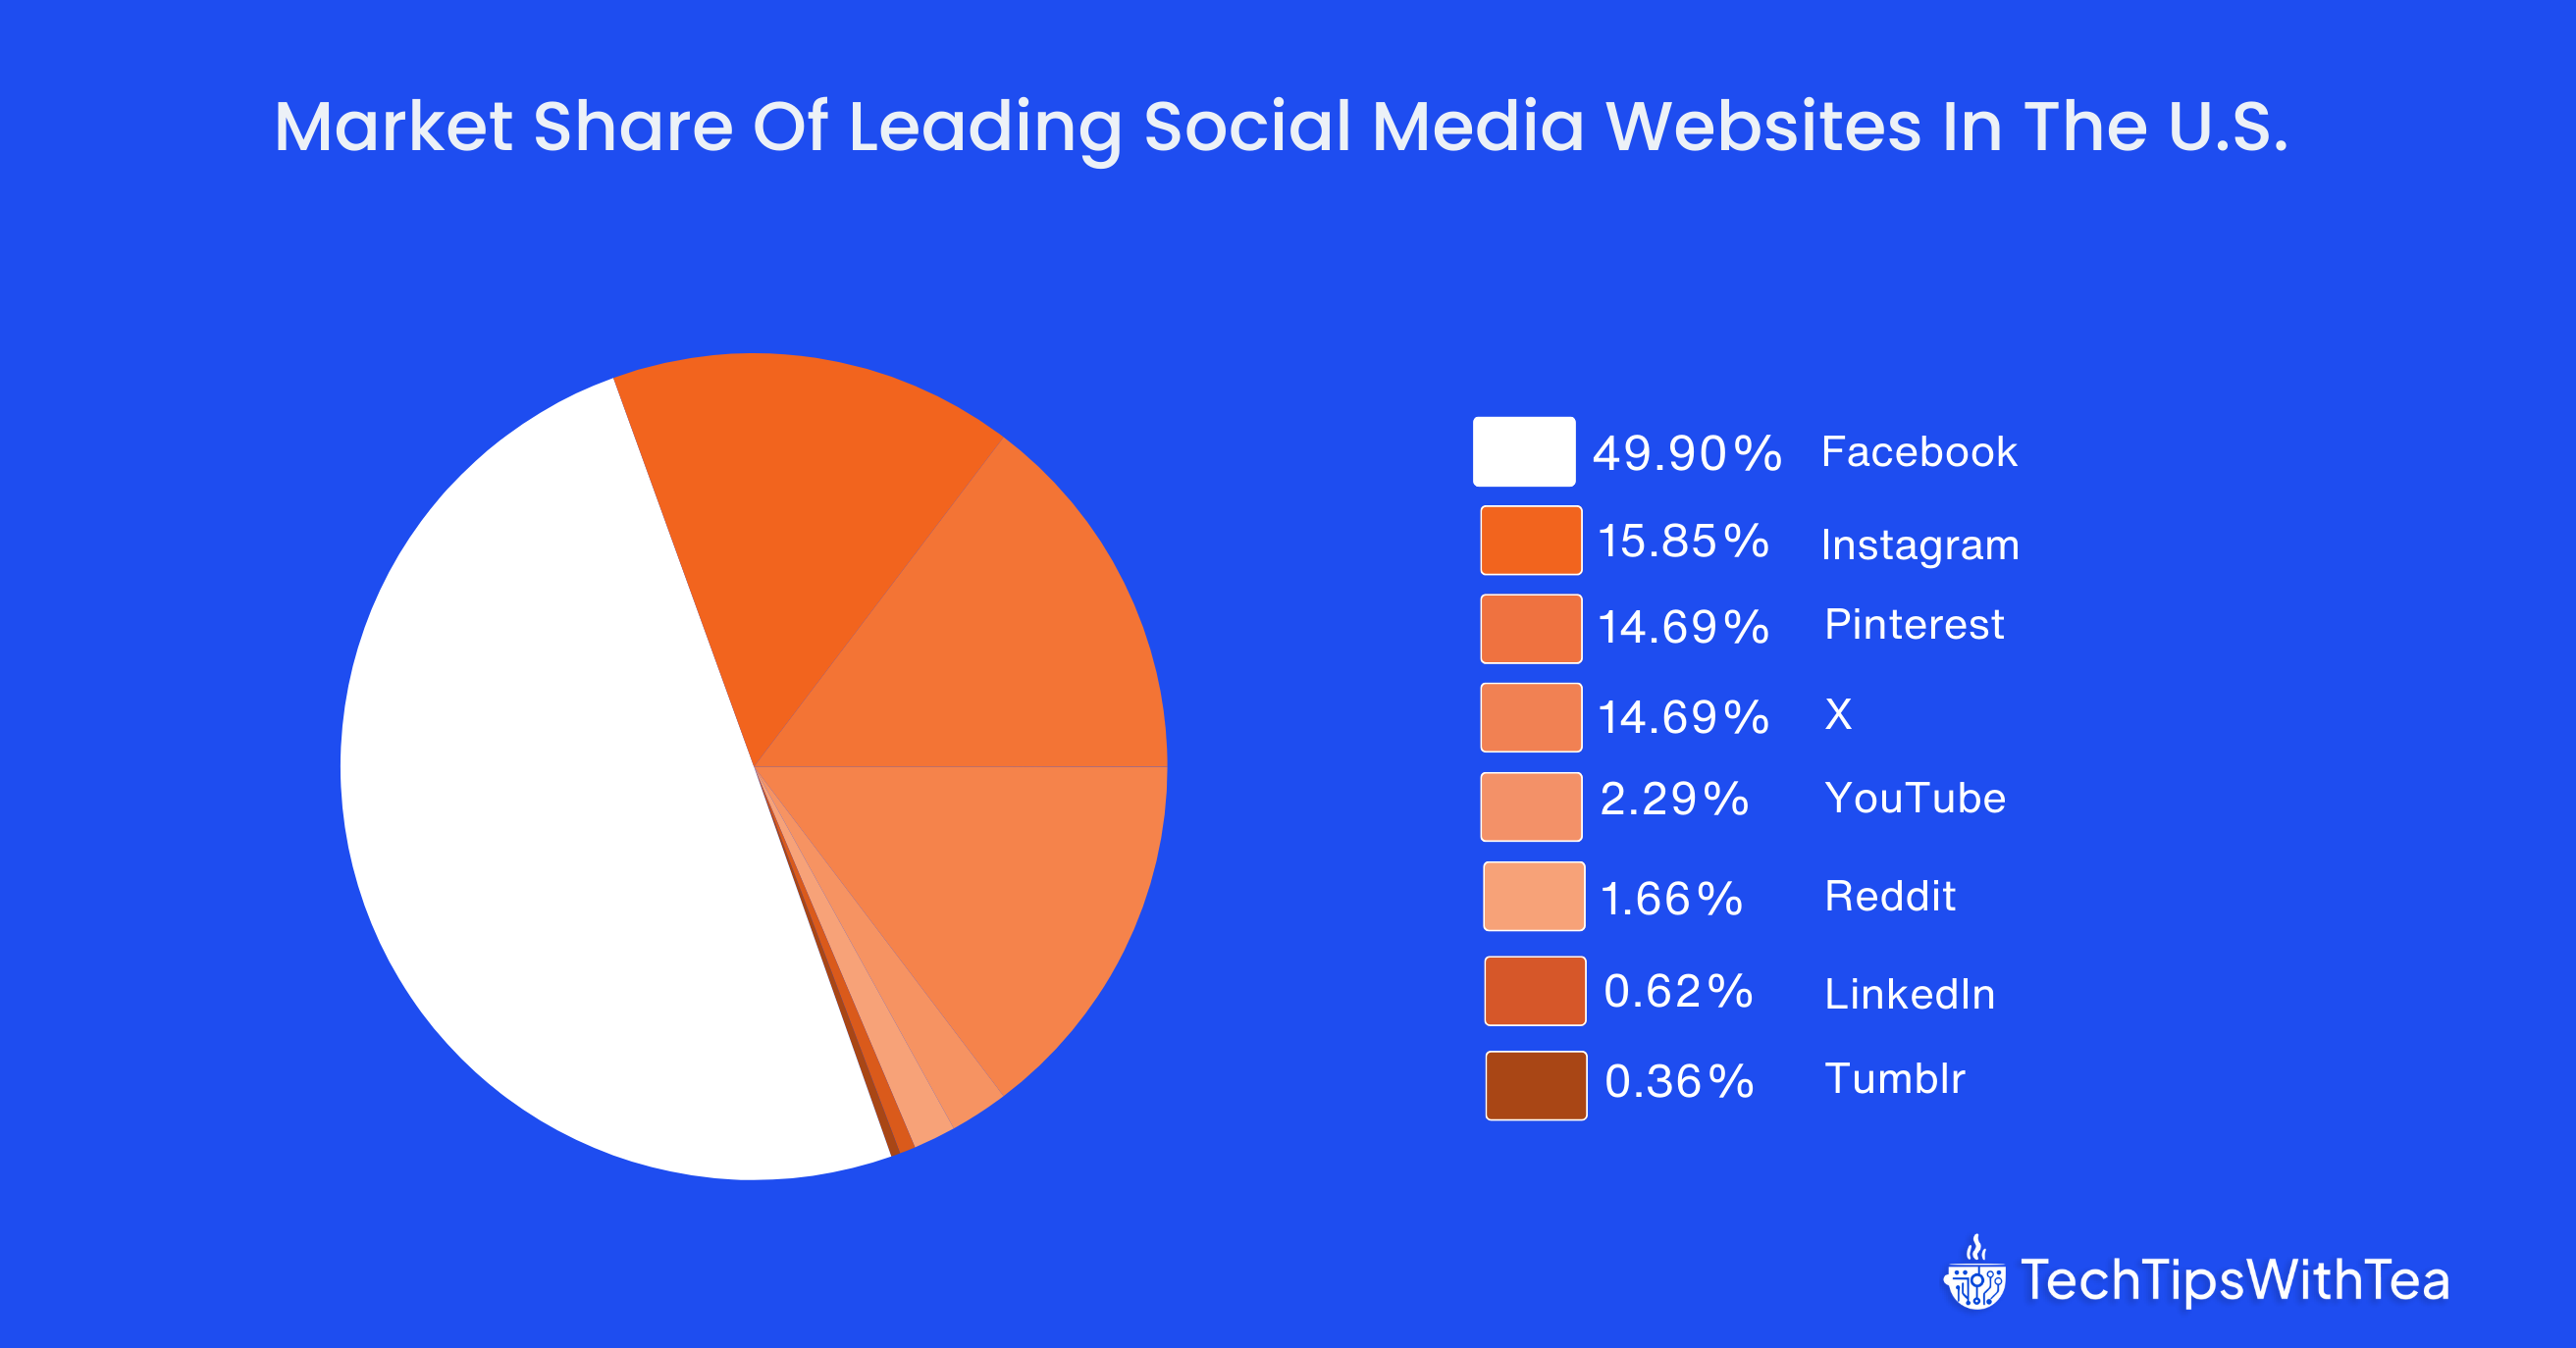
Here is a table with the market share of leading social media websites in the U.S.
| Social media platform | Percentage share |
|---|---|
| 49.9% | |
| 15.85% | |
| 14.69% | |
| X | 14.69% |
| YouTube | 2.29% |
| 1.66% | |
| 0.62% | |
| Tumblr | 0.36% |
Source: Statista
Facebook Revenue Statistics
Facebook Inc. rebranded the company name to Meta in 2021. Meta is a conglomerate that includes Facebook, Instagram, WhatsApp, and Threads.
This section will explore Meta’s financial statistics, including revenue and other statistics.
Meta Generated Over $134.9 Billion In Revenue In 2023
Meta has experienced increasing revenue since 2018, growing by over 141.6% between 2018 and 2023.
Meta’s annual revenue was around $55.83 billion in 2018, which rose to over $134.9 billion in 2023.
The revenue has grown consistently, with an average increase of approximately 30.36% in the last decade.
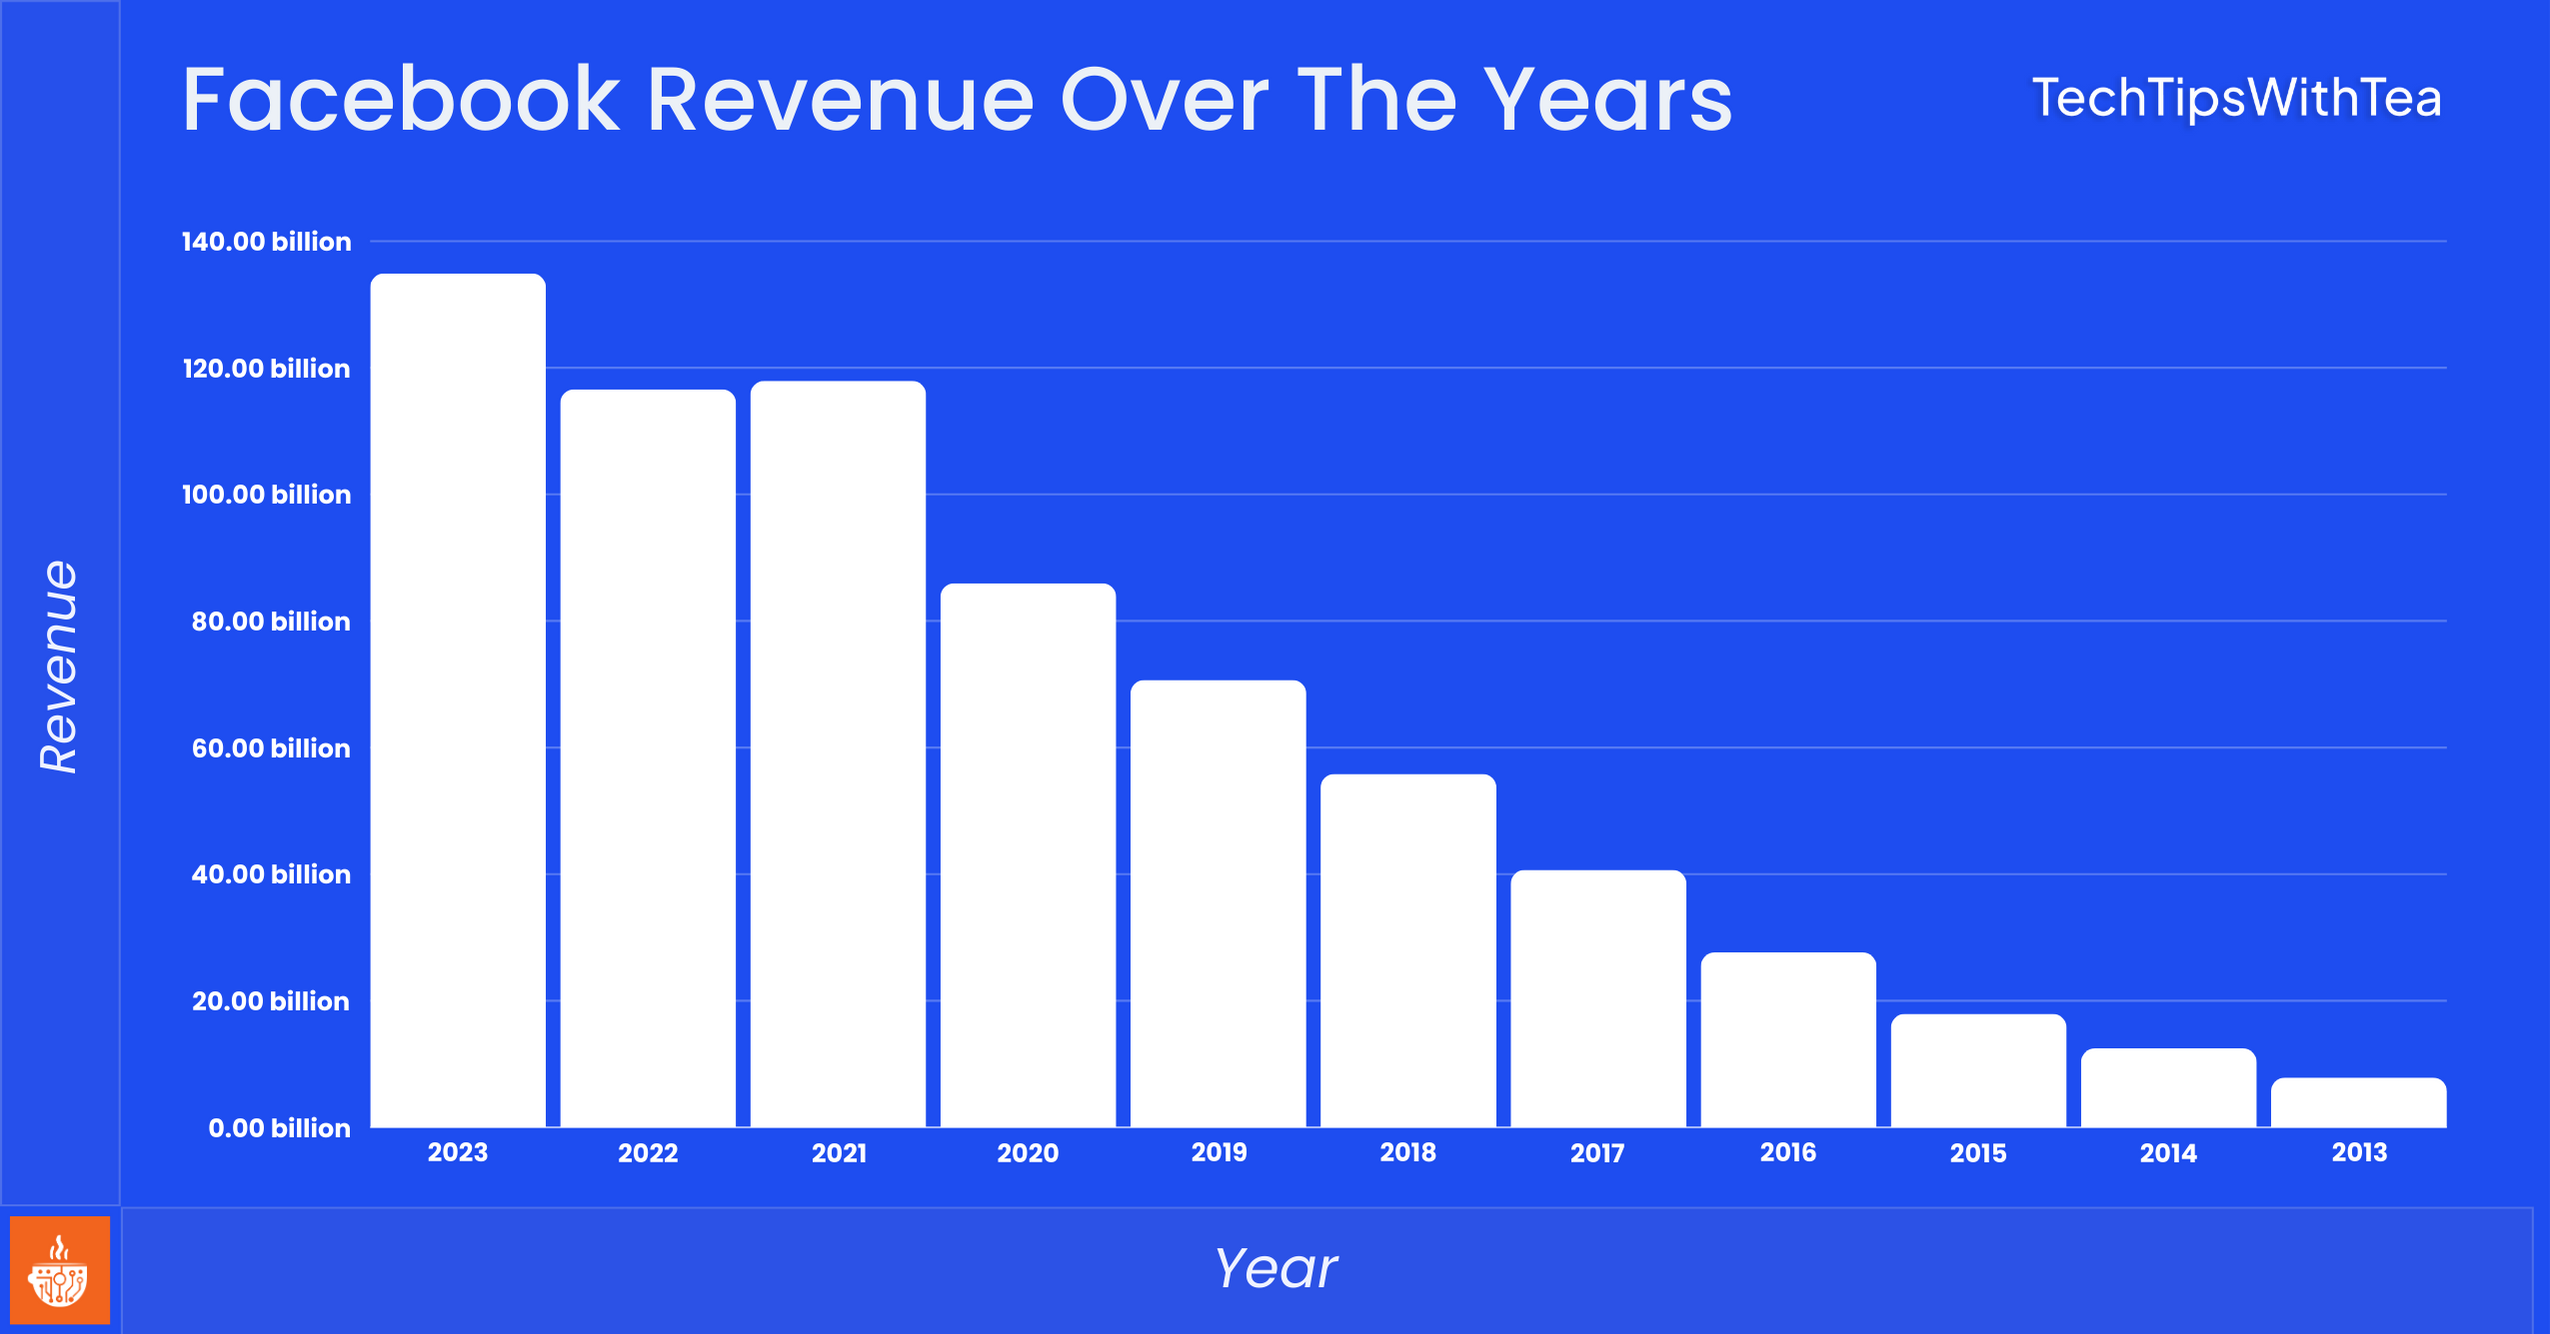
Here is a breakdown of Meta’s annual revenue over the past years:
| Year | Revenue |
|---|---|
| 2023 | $134.9 billion |
| 2022 | $116.6 billion |
| 2021 | $117.92 billion |
| 2020 | $85.96 billion |
| 2019 | $70.69 billion |
| 2018 | $55.83 billion |
| 2017 | $40.65 billion |
| 2016 | $27.63 billion |
| 2015 | $17.92 billion |
| 2014 | $12.46 billion |
| 2013 | $7.87 billion |
Source: Meta, BusinessOfApps
Facebook’s Average Revenue Per User Is Around $68.44 In The U.S. And Canadian Region
Facebook’s global average revenue per user is around $13.12 in 2023.
The United States and Canada have the highest average revenue per user of over $68.44 in 2023.
On the other hand, the Europe region registered an average revenue per user of around $23.14, while the Asia Pacific region has an ARPU of about $5.52
Here is a table with Facebook’s average revenue per user over the years in the United States and Canada:
| Year | United States and Canada ARPU | Global ARPU |
|---|---|---|
| 2023 Q4 | $68.44 | $13.12 |
| 2023 Q3 | $56.11 | $11.23 |
| 2023 Q2 | $53.53 | $10.63 |
| 2023 Q1 | $48.85 | $9.62 |
| 2022 Q4 | $58.77 | $10.86 |
| 2022 Q3 | $49.13 | $9.41 |
| 2022 Q2 | $50.25 | $9.82 |
| 2022 Q1 | $48.29 | $9.54 |
Source: Statista
Facebook Marketing Statistics
With the rise of social media marketing in recent times, Facebook is used by many marketers to benefit from the latest marketing trends.
In this section, we will explore some statistics about the use of Facebook in marketing activities.
Facebook Is Used By Over 89% Of The Marketers
A global survey concluded that Facebook is the most popular social media platform among marketers.
Around 89% of marketers reported using Facebook, and 80% reported using Instagram to run their marketing campaigns.
TikTok was used by 26% of marketers, and 54% used YouTube for marketing purposes.
Here is a table with social media platform usage for marketing:
| Social platform | Percentage of marketers |
|---|---|
| 89% | |
| 80% | |
| 64% | |
| YouTube | 54% |
| 44% | |
| TikTok | 26% |
Source: Statista
Facebook Has The Highest ROI Of 29% Among All Social Platforms
The effectiveness of using Facebook for marketing has proven fruitful for many marketers.
Marketers who leveraged Facebook and Instagram for marketing experienced 29% ROI.
Marketers using YouTube for marketing received an ROI of about 26%, while marketers using TikTok got about 24% ROI.
Here is a table with the ROI of different social media platforms:
| Platform | ROI |
|---|---|
| 29% | |
| 29% | |
| YouTube | 26% |
| TikTok | 24% |
| 16% | |
| X | 16% |
| Snapchat | 6% |
| 6% | |
| Twitch | 5% |
| Tumblr | 2% |
Source: Statista
Conclusion
Facebook is one of the biggest and oldest social media platforms, with the most users in 2024.
Facebook now has over 3.06 billion monthly active users and the most extensive user base in India.
Due to the benefits and returns of using social media marketing, the use of Facebook has increased in marketing.
These were the most important statistics about Facebook users, usage, and social media marketing.
Check out more related articles here: